


So your school has established its web ecosystem and has a digital marketing plan in place, but have you decided what the objectives for the entire web system are? Is this a lead generation tool or purely for institutional prestige? Have you identified your key performance metrics yet? Do you know whether your marketing efforts are really paying off or not?
Establishing goals and setting benchmarks is the key to all initiatives, especially when your school begins to standardize all the marketing measurement across its leads channels and media partners.
For example, if you school website has an online application form, setting funnel visualization will help you to analyze and measure the performance of each and every step of the application form path.
There is a wide variety of digital metrics which you should monitor to gain insight into the interaction of the audience with your web ecosystem and metrics to help improve the performance of the website. Some of the key metrics are as follows:
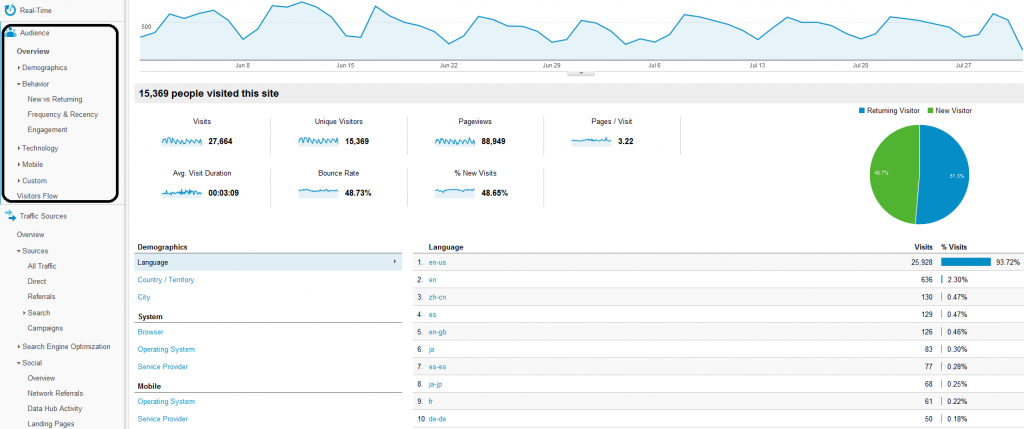
User engagement and loyalty Metrics
(Average Time spent, Bounce rate, New vs Return visitors, Bounce rate, Page views/visit etc.)
User engagement is the quality of the user experience that represents the positive aspects of the interaction, and in particular the phenomena associated with being charmed by a web system. In a world full of enticing options where the fleeting attention of the user becomes a vital resource, it is essential that your school designs a highly engaging experience. There are bunch of metrics you can use to measure user experience and to get further actionable insights. The commonly used ones are as follows:
Bounce Rate: Percentage of visits that go only one page before leaving the website.
New Vs Return Visitors: The ratio of new to returning visitors. This is an important metrics to measure quality of the page content and user loyalty.
PageViews/Visit : This is an excellent indicator of how compelling and accessible your content is.
Average time spent: It can be defined as the amount of time user spent on your web ecosystem across all visits.
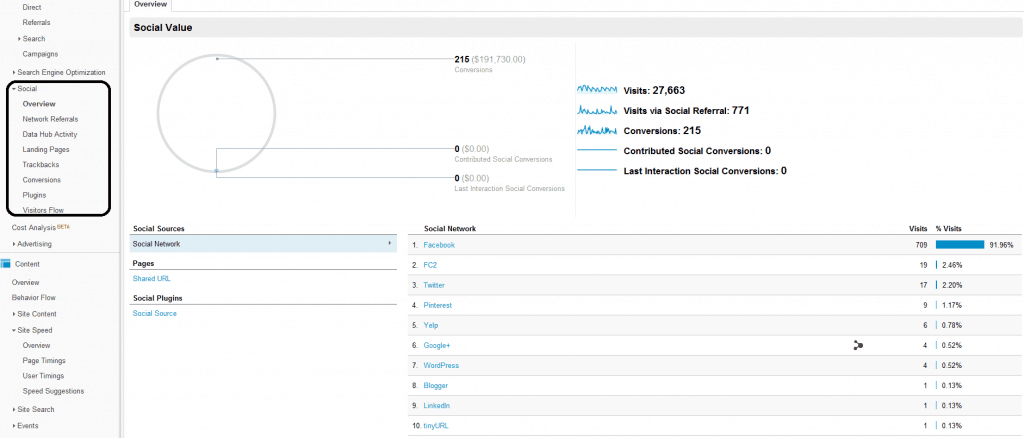
Social Voices Metrics
(Social referral, trackbacks, datahub activity, etc.)
Social media management has come a long way in the last few years but measurability is still the biggest challenge. In most of the cases, the impact of the social media is likely to have primarily effects in non-conversion behaviors. For example: people comment or share their opinions about your school’s programs and any on-campus activity. This sharing creates exposure, builds community, generates awareness about your school and your brand, and eventually creates conversions into enrollment. There are a couple of social media metrics you could use to measure the effectiveness of this process and the impact on your school’s goals and conversions. Here are commonly used ones:
Social referral: This helps to analyze and understand that which social network is referring the highest quality traffic to your school’s website.
DataHub: It helps to understand how people are talking about and engaging with your web content.
Trackbacks: Trackback shows which websites are linking (or sharing) your webpage and in which context.
Revenue Metrics
(Conversion rate, Transactions, Click through rate etc.)
There is an omnipresent need for the marketing team to justify marketing expenditures to the school administration. This can only be accomplished when you’ve established a direct relation between marketing metrics and future lead acquisitions and school performance. Virtually all web analytics tools, like Google Analytics, Kiss metric, Omniture, Sitecatalyst, etc. allow actual values from your online payment gateway to be fully integrated into analytics dashboards and reports. There are a couple of key metrics which can provide you in-depth insights of your marketing effort and school’s website performance. The commonly used ones are:
Conversion Rate: Percentage of visits that result in a conversion to a goal
Click through rate: Number of times a click is made on a link (or button) by the total impression.
Transactions: The total number of transaction occurred (for e-commerce enabled websites)
Performance Metrics
(Page load time, robot indexing, User timings, etc.)
New technology allows us to take a deeper look at the impact of web performance on the full range of the user experience (e.g. desktop, mobile, tablets etc.) to add to existing useful metrics like measuring the load time. There is an abundance of metrics to assess the performance of your school’s web ecosystem. Here are some of the most popular:
Page load time: Average time to load the entire webpage.
User Timings: The average time it takes for the timed code to execute.
You can use speed suggestions to refine and optimize your website performance further.

Google also offers a complete webmaster suite to monitor your website performance in a deeper sense such as robot indexing, malware, backlink profile, etc.
The vulnerability of the current economy is putting pressure on marketers and analysts to be more and more accountable and better focus their budgets. Still, many marketers are relying on basic analytics metrics like pageviews and unique visitors to measure the success of their marketing efforts. Unfortunately these traffic related metrics do not provide significant insights as they leave unanswered the rudimentary questions about effectiveness and economical value of any campaign. To get the most value out of your website and marketing budget, you should make sure you’re measuring the right things in the right way.


