



Consider the last time you made an important decision. While weighing your options, you probably moved through a familiar series of stages: recognizing a need, gathering information, comparing alternatives, asking questions and finally deciding what to do next.
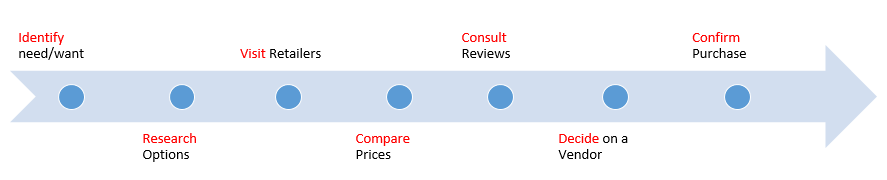
Now consider how that process compares with the steps students take when selecting a school or program. Do you know how your institution fares as prospective students move from first awareness to inquiry, application, acceptance and enrollment? What kinds of experiences do they have when interacting with your website, staff, events, emails, forms and portals? Can you pinpoint the moments that build confidence—and the points where confusion, delay or unnecessary effort cause people to leave?
In the business world, marketing and experience teams study customer journeys so they can improve messages, services and handoffs. Higher education recruitment teams can apply the same principle without reducing a major education decision to a simple purchase. A journey map is a visual account of the process a person goes through to accomplish a goal. For a school, that means taking a walk in the prospect’s shoes while also examining the people, content, systems and policies behind every interaction.
Student journey mapping is different from an admissions funnel. A funnel shows how many people progress from one measurable stage to the next. A journey map explains what they are trying to do, what they encounter, how they feel and why they may advance, pause or abandon the process. Used together, the two tools help schools connect conversion data with the real experience behind it.
Here are four practical approaches for constructing and improving student journey maps for your school.
1. Organize Your Student Personas
Few higher education marketing initiatives can get off the ground without a clear understanding of the students they are intended to serve, and journey mapping is no exception. The first stage is to define the most important audiences and the specific journey you want to understand.
A prospective undergraduate, an international graduate applicant, a transfer student and a working adult considering an online certificate may all move through broadly similar recruitment stages. Their questions, constraints and preferred touchpoints can be very different. One may spend considerable time comparing program pages and financial aid information. Another may depend on an education agent, attend a virtual event and need detailed guidance about documents, timelines and immigration processes. A third may want to speak with an adviser before completing any form.
Personas should be based on evidence rather than convenient assumptions. Useful sources include:
- CRM and application data
- Interviews with current students, applicants and non-enrolling prospects
- Admissions, financial aid and student support questions
- Website search terms and high-use pages
- Call, chat and email themes
- Event and campus visit feedback
- Application withdrawal and deferral reasons
- Program, market, language and delivery-format patterns
HEM’s guide to creating student personas provides a useful starting point. Keep the number manageable and make each persona actionable. A persona should help the team decide what information to provide, which barriers to investigate and how the experience may need to change.
It is also important to define the map’s scope. Trying to document every possible interaction from childhood awareness to graduation will produce a map too large to use. Begin with one audience, one goal and one bounded journey—for example, an international student moving from program discovery to a completed application, or an accepted online learner moving from offer to first class.
2. Identify College-Student Touchpoints
How do prospective students first hear about your school, investigate its programs, ask for help, apply and decide whether to enroll? To understand the journey, identify the moments when a student interacts with the institution, its representatives or its information.
Typical stages may include:
- Initial awareness
- Program and career exploration
- Shortlisting and comparison
- Inquiry and advising
- Event or campus visit
- Application and document submission
- Offer and financial decision
- Deposit, registration and pre-arrival preparation
- Orientation and transition into study
Within those stages, touchpoints may include search results, social media, third-party listings, program pages, tuition information, webinars, emails, phone calls, live chat, campus tours, agents, application forms, payment systems, applicant portals, scholarship decisions and orientation communications.
Student Journey Map: Phase One
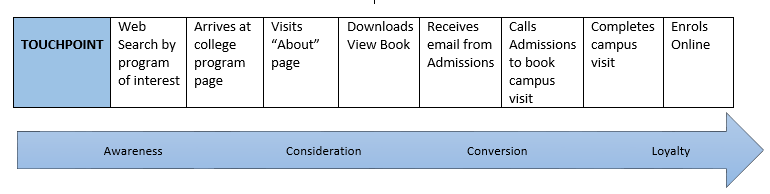
For each stage, record more than the channel name. A useful map can show:
- What the student is trying to accomplish
- The questions they need answered
- The action they take
- The touchpoint or channel involved
- The content, form or service they encounter
- How they feel
- The team responsible
- The system involved
- The evidence or metric available
- Known barriers and opportunities
Identifying touchpoints should be a collaborative effort. Marketing may understand campaign entry points and website content. Admissions sees questions, follow-up delays and application barriers. IT understands integrations and system limitations. Financial aid, registrarial teams, international offices, faculty, student services and campus visit staff each see parts of the journey that others may miss.
The process does not have to begin with expensive software. A workshop using sticky notes or a shared digital board can help teams arrange stages, debate assumptions and identify gaps. The map becomes more valuable when students and recent applicants are invited to challenge the institution’s internal view.
For complicated journeys, consider adding a service-blueprint layer. The journey map captures what the student sees and experiences. The blueprint adds the less visible work required to deliver it: CRM routing, document review, scholarship approval, application status updates, data transfers, staff handoffs and support processes. This often reveals that a frustrating student touchpoint is caused by an internal ownership or system problem rather than weak marketing copy.
3. Gather Feedback and Recognize Pain Points
For every important touchpoint, the school must consider the quality of the interaction. The most reliable map combines what people say, what they actually do and what institutional data shows.
Interviews and surveys can reveal expectations, motivations and memories of the process. Usability testing can show where representative users struggle while completing realistic tasks, such as finding entry requirements, comparing tuition, submitting an inquiry or checking an application status. Admissions notes, support tickets, site-search queries and form errors reveal recurring questions. Analytics and CRM data can show where engagement falls, how long stages take and which groups encounter different outcomes.
Useful evidence may include:
- Task completion and usability observations
- Website and portal behaviour
- Form starts, errors and abandonment
- Response and document-processing times
- Event attendance and follow-up
- Application completion and offer acceptance
- Reasons for withdrawal, deferral or non-enrollment
- Feedback from advisers and front-line staff
- Accessibility barriers and requests for assistance
Do not rely only on averages. A journey that appears healthy overall may contain serious friction for mobile users, international applicants, people using assistive technology, students applying in a second language or applicants to one particular program. At the same time, personalization should not become an excuse for intrusive tracking or unnecessary collection of sensitive information. Use the minimum data required, aggregate findings where possible and follow the institution’s privacy and consent requirements.
Student Journey Map: Phase Two

Pain points are not limited to obvious technical failures. They may include:
- Important information scattered across several pages
- Requirements written in language applicants do not understand
- Conflicting deadlines or costs
- Forms that ask for information the institution already has
- Slow responses or unclear ownership
- Application status messages that do not explain the next step
- Communications that arrive in the wrong order
- Broken handoffs between marketing, admissions and student services
- Pages, forms or authentication processes that are not accessible
Plotting an emotional line across the journey can help teams recognize moments of anxiety, uncertainty, relief and excitement. It should be grounded in research, not guessed in a workshop. Pay particular attention to moments of truth: the interactions that strongly influence whether a student trusts the institution enough to continue.
4. Strategize Improvements—and Repeat the Process
Once the map contains real evidence, marketing and admissions teams can identify where change will have the greatest effect. The goal is not to redesign every touchpoint at once. Prioritize improvements according to the severity of the problem, the number of students affected, the strength of the evidence, institutional risk, expected value and the effort required.
Each selected improvement should have:
- A clearly defined problem
- An accountable owner
- A proposed change
- A success measure
- A deadline
- Dependencies on other teams or systems
- A plan for testing the result
A journey map may reveal that an application page needs clearer instructions, but it may also show that the underlying problem is a complicated document policy. An email rewrite will not solve a five-day lead-routing delay. A new portal will not help if status information is inaccurate. Effective improvements address both the visible experience and the process behind it.
Student Journey Map: Final Product

Measurement should connect the map with the admissions funnel without confusing activity with progress. Google Analytics 4 can measure website actions such as information requests, event registrations and application starts. Google recommends events including generate_lead, qualify_lead, working_lead and close_convert_lead for lead journeys that continue offline. The CRM should confirm qualification, adviser contact, application and offer stages, while the student information system confirms deposit, registration, enrollment and retention.
HEM’s guides to reviewing the admissions funnel and conversion tracking for schools can help connect journey insights with measurable outcomes.
Analytics must also respect user choice. Consent tools and tag configurations should ensure that analytics and advertising technologies respond appropriately to the permissions a visitor provides. Where measurement gaps remain, teams should acknowledge them rather than pretending the journey data is complete.
Student journey mapping is a cyclical process of recognizing needs, testing changes, measuring their effect and starting again. Review the map when programs, policies, platforms, markets or admissions processes change, and schedule a broader review at least annually. The map should remain a working decision tool, not a workshop poster that disappears into a shared drive.
As higher education recruitment becomes more digital and more automated, the value of personalization lies in making the experience more useful and human—not simply inserting a prospect’s name into a message. By understanding what students are trying to accomplish and coordinating the teams responsible for helping them, schools can minimize assumptions, reduce unnecessary friction and improve both conversion and trust.
Have you tried student journey mapping at your school? What did you learn about the moments that help prospective students move forward—or cause them to stop?
Frequently Asked Questions About Student Journey Mapping
What is student journey mapping?
Student journey mapping is the process of visualizing the stages, actions, questions, touchpoints, emotions and barriers a student encounters while working toward a goal, such as selecting a program, completing an application or preparing to enroll.
How is a student journey map different from an admissions funnel?
An admissions funnel measures how many prospects progress through stages such as inquiry, application, offer and enrollment. A journey map explains the experience behind those numbers, including what students are trying to do, where they struggle and which institutional processes influence the outcome.
Which stages should a student journey map include?
The scope depends on the question being investigated. A recruitment map may include awareness, exploration, inquiry, application, decision, deposit and enrollment. A narrower map may focus only on applying, accepting an offer or preparing for the first day.
Who should participate in a journey-mapping workshop?
Include the teams involved in the selected journey, such as marketing, admissions, financial aid, registrarial services, international recruitment, IT, student services and faculty. Current students, recent applicants and people who did not enroll can provide essential evidence that internal teams cannot supply.
What data should schools use?
Combine interviews, surveys and usability testing with website analytics, CRM stages, application data, response times, form errors, support questions and reasons for non-enrollment. No single source provides a complete account of the journey.
How often should a student journey map be updated?
Update the map whenever a major program, policy, technology or admissions process changes. A broader annual review is a practical minimum, with more frequent checks for high-volume or rapidly changing journeys.
Can journey mapping improve personalization?
Yes. It helps schools tailor information and support to a student’s goals, stage and unresolved questions. Personalization should remain transparent, relevant and proportionate, with privacy and consent requirements built into the process.


